Generate chart
Smart CSV empowers you to generate charts directly from your CSV content. Follow these steps to create a chart:
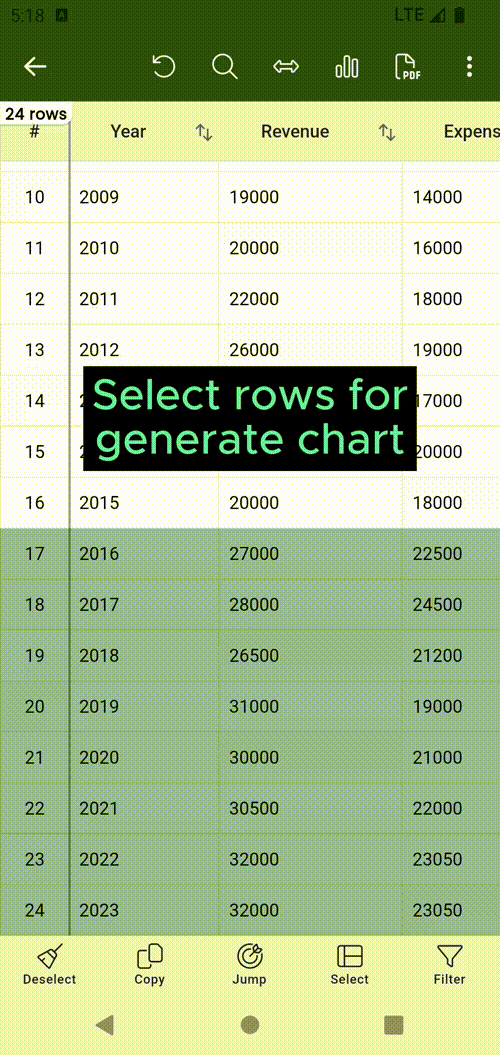
- Select specific rows or all for chart data.
- Click on the button (on the top of screen).
- Custom chart types, labels & series to match your request.
- Finally, click on the button to save the chart.
Warning
You can only generate chart if the data contains at least on serier (a column that contains number value).
Note
You can view your chart file in the (exported) tab in the Home screen.
Custom chart type
You can click on the Type button to select chart type.
Smart CSV support following chart types:
- Column chart.
- Bar chart.
- Line chart.
- Area chart.
- Spline chart.
- Scatter chart.
- Step line chart.
- Step area chart.
- Pie chart.
- Doughnut chart.
- Pyramid chart.
Custom labels
You can click on the Labels button to select label which is used for the chart.
Custom series
You can click on the Series button to select the series data point to mapping with above labels for the chart.